Posts
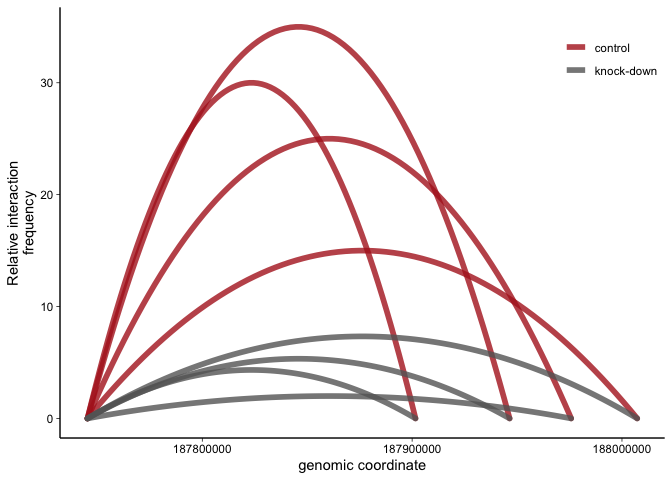 |
Plotting 3C data as arcs - a ggplot solution 3C data measuring the interaction frequency between two genomic coordinates can be represented graphically as arcs between the anchor (aka viewpoint) and the region of interest. Here’s how to do this with ggplot. |
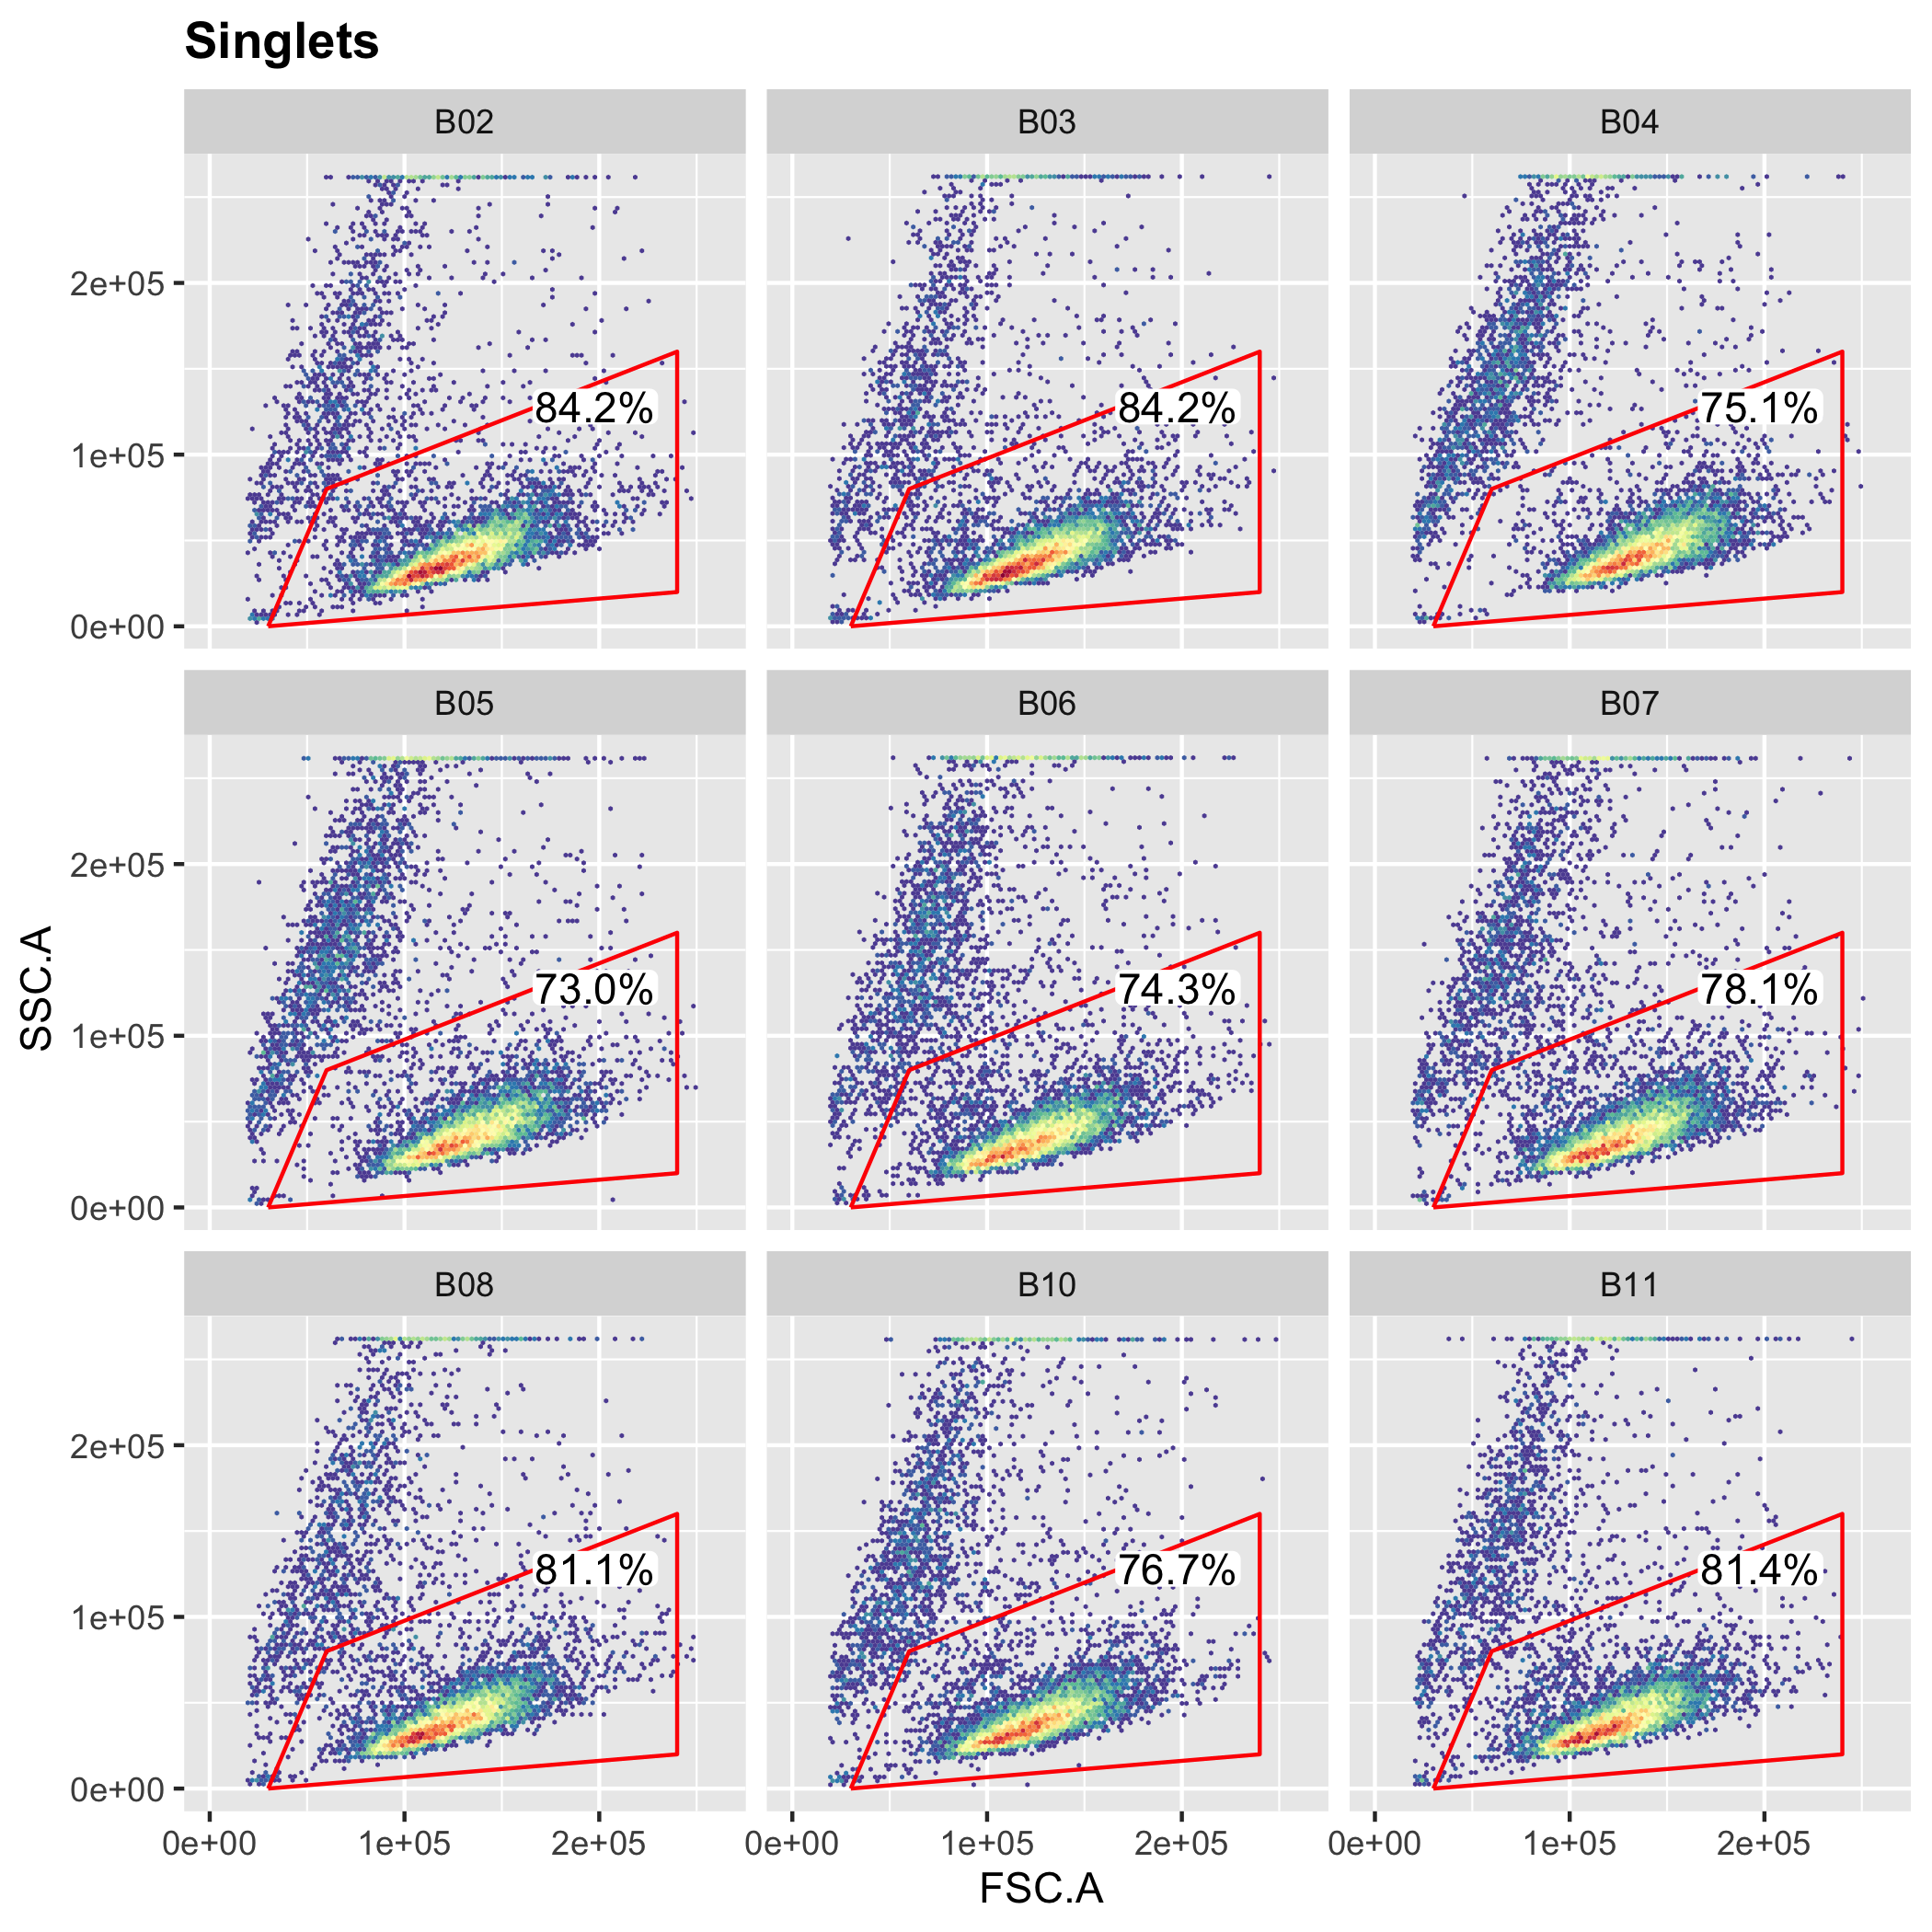 |
Analyzing high-throughput FACS assays with R Traditional flow cytometry analysis software performs badly with large datasets. Here’s an example analysis workflow for a simple FACS-based assay run in 96-well format. |
Code and resources from published papers
Unique Immune Cell Coactivators Specify Locus Control Region Function and Cell Stage
Chu and Hellmuth et al.
Mol Cell. 2020. PubMed PMID: 33232656.
View or download PDF here
Resources:
- A UCSC track hub to fully explore all relevant data at the BCL6 locus is available here
- A version of this track hub with highlights for each constituent enhancer is available here
Code:
- In silico design for a maximum density CRISPR screening library - script 1.1
- Analysis of CRISPRi screening results
- Screening data normalization and QC script 2.1
- Identification of essential enhancers script 2.2
- R-based FACS analysis for drop-out experiments
- Transcrition factor motif analysis
- Motif download, processing and matching to a region of interest (BCL6 locus) - script 4.1
- Motif density comparison in essential vs non-essential enhancers - script 4.2