Plotting 3C data as arcs - a ggplot solution
Introduction
3C data measuring the interaction frequency between two genomic coordinates can be represented graphically in different ways. Often, simple barplots are used and comics are drawn to indicate the genomic position of anchors and restriction fragments of interest. However, this can be tedious and errorprone. 3C data can also be represented as arcs spanning from the anchor (aka viewpoint) to the regions of interest (aka restriction fragments) rendering a precise illustration of the genomic context. In these plots, the interaction frequency correlates with the hight of the arc. A published example of such a plot can be found here. To my knowledge, there is no R package that conveniently generates this kind of plot. Below is my ggplot solution to generate ‘3C arc plots’. Feel free to email me with any questions, improvements or comments.
Load packages and set ggplot themes
# load required packages
library(tidyverse)
# these are general theme settings I commonly use for publication-grade plots
theme_linedraw_noframe <- theme_linedraw()+
  theme(panel.grid = element_blank(),
        panel.border = element_blank(),
        axis.line = element_line(),
        legend.justification = c(1, 1),
        legend.position = c(1, 1)) # move the legend into the plot
Load data
The dummy datasets is an example of an 3C experiment you would do in the lab: From one specific anchor, the interaction frequencies to 4 different fragments of interest are tested in two different conditions (control and knock-down). For each condition we have 3 replicates. If you would like to follow along, download the dummy data here.
# read 3C data
df <- read_tsv("../downloads/2020-01-03-3C-dummy-data.txt")
Reformat data
The following steps first convert the data to long format (generally
required for plotting with ggplot) using dplyr’s gather. We then
generate the midpoint between anchor and fragment of interest - this is
essentially the coordinate where the interaction frequency data will be
plotted.
We then summarize the data from all three replicates in each group for
each assay (i.e. anchor - fragment pair) using dplyr’s group_by and
summarize.
To plot a nice arc from anchor, over midpoint to fragment of interest
coordinates, we need to ‘add back’ the anchor and fragment rows to the
long format (this is done by another gather command) and set the
interaction frequency at these points to 0 (once you look at the final
plot, this will make sense).
Because ggplot’s geom_line needs groups to know which points should be
connected, a new column combining condition and assay.name is generated.
# gather to convert from wide to long format
dfg <- df %>%
  gather(-assay.name,-anchor.coord,-fragment.coord,key = "sample",value = "frequency")
# extract condition from sample name
dfg$condition <- gsub("\\..*","",dfg$sample)
# calculate midpoint between each anchor and bait coordinate (the interaction frequency is going to be plotted over this coordinate)
dfg$mid.coord=(dfg$fragment.coord+dfg$anchor.coord)/2
# summarize data
dfs <- dfg %>%
  group_by(condition,anchor.coord,fragment.coord,mid.coord,assay.name) %>%
  summarise(mean.frequency=mean(frequency),sd.frequency=sd(frequency))
# 'add back' anchor and fragment rows using gather and rename key / points
dfsg <- dfs %>%
  gather(-condition,-mean.frequency,-sd.frequency,-assay.name,key = point,value = coord) %>%
  mutate(point=gsub(".coord","",point))
# set anchor and probe frequency to 0:
dfsg$mean.frequency[dfsg$point %in% c("anchor","fragment")] <- 0
# add group column (for ggplot's geom_line)
dfsg$group <- paste0(dfsg$condition,dfsg$assay.name)
Plots
3C arc plot
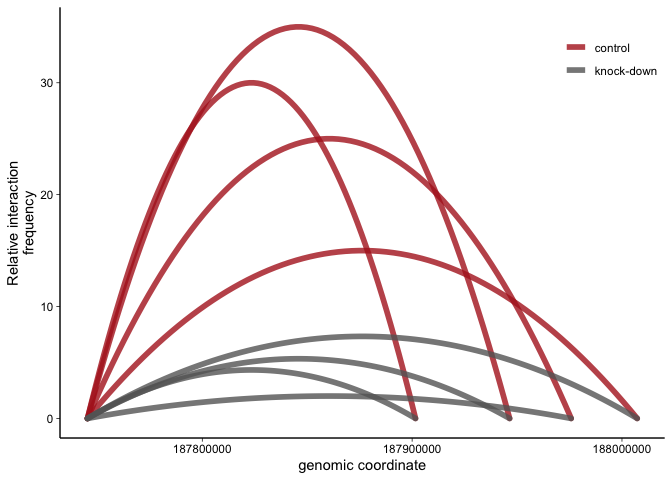
The basic principle here is to use ggplots stat_smooth to plot a
second degree polynomial regression line from the anchor over the
midpoint to the fragment of interest genomic coordinates. Note that the
interaction frequency at the anchor and the fragment are set to 0. The
actual interaction frequency data is plotted to the midpoint.
p <- ggplot(dfsg,aes(x=coord,y=mean.frequency,color=condition,group=group))+
  geom_line(stat="smooth",method = "lm",formula = y ~ poly(x, 2),
            se = FALSE,lineend="round",size=2,alpha=0.8)+
  scale_color_manual(values = c("firebrick","grey40"))+ # pick colors manually
  labs(y="Relative interaction\nfrequency",x="genomic coordinate",color="")+ # rename axis labels
  theme_linedraw_noframe # these are the theme settings defined above
p
3C arc plot with errorbars
If you like, you could add errorbars to this plot - depending on how many fragments you are looking at, this could get messy though.
p+geom_errorbar(dfsg %>% filter(point=="mid"),inherit.aes = F,size=0.5,
                mapping = aes(x=coord,ymin=mean.frequency-sd.frequency,ymax=mean.frequency+sd.frequency,color=condition))

3C barplot with arcs
with arcs Of course, 3C data can be represented as simple barplots. Here is a barplot where the 3C arcs are added in. Arcs are only represented for the most important condition. This could be useful, for example, when you have multiple conditions that would overcrowd the 3C arc plot above.
ggplot()+
  geom_line(dfsg %>% filter(condition=="control"),mapping=aes(x=coord,y=mean.frequency,color=condition,group=group),
            stat="smooth",method = "lm",formula = y ~ poly(x, 2),
            se = FALSE,lineend="round",size=2,alpha=0.8)+
  geom_bar(dfs,
           mapping = aes(x=fragment.coord,y=mean.frequency,fill=condition),
           stat='identity',position=position_dodge())+
  scale_color_manual(values = c("firebrick","grey40"))+ # pick colors manually
  scale_fill_manual(values = c("firebrick","grey40"))+ # pick colors manually
  labs(y="Relative interaction\nfrequency",x="genomic coordinate",fill="")+ # rename axis labels
  theme_linedraw_noframe+ # these are the theme settings defined above
  guides(color=F)

Please feel free to email me with any questions, comments or suggestions and I’ll be happy to post them here.
info at jchellmuth.com